The CARM Tool
Cross-platform Cache-Aware Roofline Model (CARM) and Application Benchmarking Tool for Intel, AMD, ARM, and RISC-V CPUs
The Cache-aware Roofline Model (CARM), developed at the CHAMP Hub at INESC-ID, is an insightful computer architecture performance model. It offers a high-level picture on the fundamental memory and compute performance limitations, while also providing intuitive analysis of the application execution bottlenecks and effectively guiding optimization efforts. The CARM Tool provides a one-stop shop for CARM related analysis across a variety of different architectures, supporting nearly all major CPU vendors and ISAs. It comprises a set of independent and complementary modules that provide a complete CARM-based profiling ecosystem, ranging from automatic system benchmarking to application analysis and result visualization.
The CARM Tool provides both a command line mode and a graphical user interface (GUI) to fully engage with the cross-platform architecture and application profiling facilities when executing user-specified tasks. Two different engines for in-depth CARM-based application analysis are provided based on: performance counters and/or dynamic binary instrumentation. With those, the performance and arithmetic intensity of analyzed applications and their hotspots (accessible via the custom built-in ROI code annotations) are automatically calculated and visualized in the tool-generated CARM plot of the architecture where the code is run. The CARM Tool also automatically saves the collected results from different platforms and application runs, which become available to be presented within the GUI or exported as SVG graphs.
The CARM Tool is equipped with a robust assembly-level automatically generating micro-benchmarking module necessary to construct the CARM on all supported processors (e.g.: Intel/AMD x86-64, ARM AARCH64, and RISCV64), for any number of threads and a large set of different instruction set extensions (such as SIMD AVX512, Neon, RVV), data precisions, and instruction types. The Tool allows for a highly accurate and user customizable micro-benchmarking of complete memory subsystems and compute units, for various problem sizes, load/store and compute-to-memory operation ratios. It fully assesses the upper-bound capabilities of FP units and memory hierarchy levels (caches and DRAM).
The CARM Tool is open-source, and it can be downloaded from Github.
Below you can also find the documentation of the CARM Tool to better understand all of its functionality.
The CARM Tool Documentation
This tool performs the micro-benchmarking necessary to constuct the Cache-Aware Roofline Model (CARM) for floating-point operations on Intel, AMD, AARCH64, and RISCV64 CPUs. It supports different instruction set extensions (AVX512, AVX, SSE, Scalar, Neon, RVV0.7), different data precisions (double- and single-precision), different floating point instructions (fused multiply and add, addition, multiplication and division). The micro-benchmarks can be performed for any number of threads. The tool provides as output a vizualization of CARM, as well as the measurements obtained for the different memory levels and selected FP instruction. The tool is also capable of the micro-benchmarking necessary to construct a memory bandwidth graph for various problem sizes, and perform mixed tests that stress the FP units and memory system at the same time.
The tool can also perform application analysis using either performance counters (via PAPI) or dynamic binary instrumentation (via DynamoRIO or Intel SDE), to view the output of these results in a CARM graph the GUI is required.
For better results visualization, ResultsGUI.py can be ran to generate a web browser based user interface for result visualization, results from other machines can be imported for visualization on any machine via the GUI, by moving the necessary result csv files to the results folder of the machine running the GUI.
Requirements
- gcc (>= 4.9 for AVX512 tests and only tested with gcc 9.3)
- python (only tested with python 3.8.8)
- matplolib (only tested with 3.3.4)
- numpy
- dash (GUI only)
- dash-bootstrap-components (GUI only)
- pandas (GUI only)
- plotly (GUI only)
- diskcache (GUI only)
- DynamoRIO (only tested with 10.93.19916) - for DBI application analysis (x86 and AARCH64) (Might require an edit to line 132 in the CustomClient Makefile to match the installed version of DynamoRIO)
- PAPI (only tested with 7.0.1) - for PMU application analysis
- Optional:
- Intel SDE (only tested with 9.33.0) - for DBI application analysis (x86)
How to use (CLI)
The first step is optional and consists in creating a configuration file for the system to test under the config folder. This configuration file is optional in x86 systems since the tool is able to automatically scan the cache sizes present, however this detection can sometimes be wrong (you can check what cache sizes have been detected by using -v 3), so a configuration file is still advised. You can also skip the configuration file by using the arguments: -l1 <l1_size (per core)> -l2 <l2_size (per core)> -l3 <l3_size (total)> and –name
This configuration file can include four fields:
- identifier of the system
- L1 size per core (in KiB)
- L2 size per core (in KiB)
- Total L3 size (in KiB)
An example configuration file looks like:
name=venus
l1_cache=32
l2_cache=1024
l3_cache=25344
After the optional creation of the configuration file, the tool can executed as:
python run.py <path_config_file> --name <name> --test <test> --inst <fp_inst> --num_ops <num_ops> --isa <[isa]> --precision <[data_precision]> --ld_st_ratio <ld_st_ratio> --fp_ld_st_ratio <fp_ld_st_ratio> --dram_bytes <dram_bytes> is the size of the array used for the DRAM benchmark in KiB; --threads <[num_threads]> --freq <frequency> --l1_size <l1_size> --l2_size <l2_size> --l3_size <l3_size> --threads_per_l1 <threads_per_l1> --threads_per_l2 <threads_per_l2> --vector_length <vector_length> --verbose [0, 1, 2, 3] [--only_ld] [--only_st] [--no_freq_measure] [--set_freq] [--interleaved] [--dram_auto] [--plot]
where
-
is the path for configuration file of the system. This should be your first argument. - –name
is the name for machine running the benchmarks (Default: unnamed) - –test
is the test to be performed (roofline, MEM, FP, L1, L2, L3, DRAM, mixedL1, mixedL2, mixedL3, mixedDRAM); - –inst
is the floating point instruction to be used (add, mul, div), fma performance is also measured by default; - –num_ops
is the number of FP operations used for the FP benchmark; - –isa
is the instruction set extension, multiple options can be seletcted by spacing them (avx512, avx2, sse, scalar, neon, armscalar, rvv0.7, rvv1.0, riscvscalar, auto); - –precision
is the precision of the data, multiple options can be seletcted by spacing them (dp, sp); - –ld_st_ratio
is the number of loads per store involed in the memory benchmarks; - –fp_ld_st_ratio
is the FP to Load/Store ratio involved in the mixed benchmarks; - –dram_bytes
is the size of the array used for the DRAM benchmark in KiB; - –threads
is the number of threads used for the test, multiple options can be selected by spacing them - –freq
expected CPU frequency if not auto-measuring (in GHz) - –l1_size
is the L1 size per core of the machine being benchmarked - –l2_size
is the L2 size per core of the machine being benchmarked - –l3_size
is the total L3 size of the machine being benchmarked - –threads_per_l1
are the expected number of threads that will share the same L1 cache (Default: 2) - –threads_per_l2
are the expected number of threads that will share the same L2 cache (Default: 2) - –vector_length
is the desired vector length in elements to be used (for riscvvector only, tool will use the max by default) - –verbose [0, 1, 2, 3] is the level of output information to be displayed during execution (0 -> No Output 1 -> Only ISA Errors and Test Details, 2 -> Intermediate Test Results, 3 -> Configuration Values Selected/Detected)
- [–only_ld] indicates that the memory benchmarks will just contain loads (
is ignored); - [–only_st] indicates that the memory benchmarks will just contain stores (
is ignored); - [–no_freq_measure] disables the automatic frequency measuring (CPU frequency should be provided in config file or via –freq argument)
- [–set_freq] will set the cpu frequency to the specified one (sudo is required, x86 only, might not work)
- [–interleaved] indicates if the cores belong to interleaved numa domains (e.g. core 0 -> node 0, core 1 -> node 1, core 2 -> node 0, etc). Used for thread binding;
- [–dram_auto] automatically adjust the DRAM test size according to number of threads to ensure individual thread data only fits in DRAM (Default: 0)
- [–plot] enables the plotting of CARM/MEM results as an SVG image, allowing for result visualization without using the GUI (Default: 0)
A simple run can be executed with the command
python run.py
which by default runs the micro-benchmarks necessary to obtain CARM data, for all available ISAs using double-precision. The FP instructions used are the ADD and FMA (32768 operations) and the memory benchmarks contain 2 loads per each store, with the DRAM test using an array with size 512MiB and 1 thread.
For additional information regarding the input arguments, run the command:
python run.py -h
To profile an application using Performance Counters, PMU_AI_Calculator.py should be executed with the following arguments:
-
Path to the PAPI directory. -
Path to the executable to analyze. -
Arguments for the executable that will be analyzed. - –name
Name for the machine running the executable (Default: unnamed); - –app_name
Name for the executable (if empty, executable name will be used); - –isa
Main ISA used by the executable, if not sure leave blank (optional only for naming facilitation);
Note that this requires the PAPI_LST_INS, PAPI_SP_OPS, and PAPI_DP_OPS events to be available on your system.
To profile an application using Dynamic Binary Instrumentation, DBI_AI_Calculator.py should be executed with the following arguments:
-
Path to the DynamoRIO directory, or Intel SDE directory if --sde is used. -
Path to the executable to analyze. - [–roi] Measure only Region of Interest, or not. (Must be previously marked in the source code);
- [–sde] Measure using Intel SDE, instead of DynamoRIO (x86 only);
- –name
Name for the machine running the executable (Default: unnamed); - –app_name
Name for the executable (if empty, executable name will be used); - –isa
Main ISA used by the executable, if not sure leave blank (optional only for naming facilitation); - –threads
Number of threads used by the application (optional only for naming facilitation); - –precision
Data Precision used by the application (optional only for naming facilitation); -
Arguments for the executable that will be analyzed. (This should be your last argument)
Note that both the PMU analysis and the DBI with ROI analysis require the previous injection of the source code with Region of Interest specific code, to facilitate this proccess you can include the dbi_carm_roi.h header file in your application directory and use the API functions to enable the DBI based ROI analysis.
CARM_roi_begin();
CARM_roi_end();
For PMU analysis via PAPI, the PAPI high level API must be used to define the region of interest via the functions.
PAPI_hl_region_begin("");
PAPI_hl_region_end("");
In case of PMU analysis the PAPI library must be linked during compilation, this can usually be done following one of these methods:
Method 1:
gcc -<Compiler flags> -I/Path/To/Papi/src <source_file.c> -o <executable_file> /Path/To/Papi/src/libpapi.a

Method 2:
gcc -<Compiler flags> -I/${PAPI_DIR}/include -L/${PAPI_DIR}/lib  <source_file.c> -o <executable_file> -lpapi
The profiling results are automatically stored in a csv assocaited with the provided machine name, these results can then be viewed using the GUI, make sure to match the machine name used in the profiling with the machine name used in the CARM benchmarks execution.
How to use (GUI)
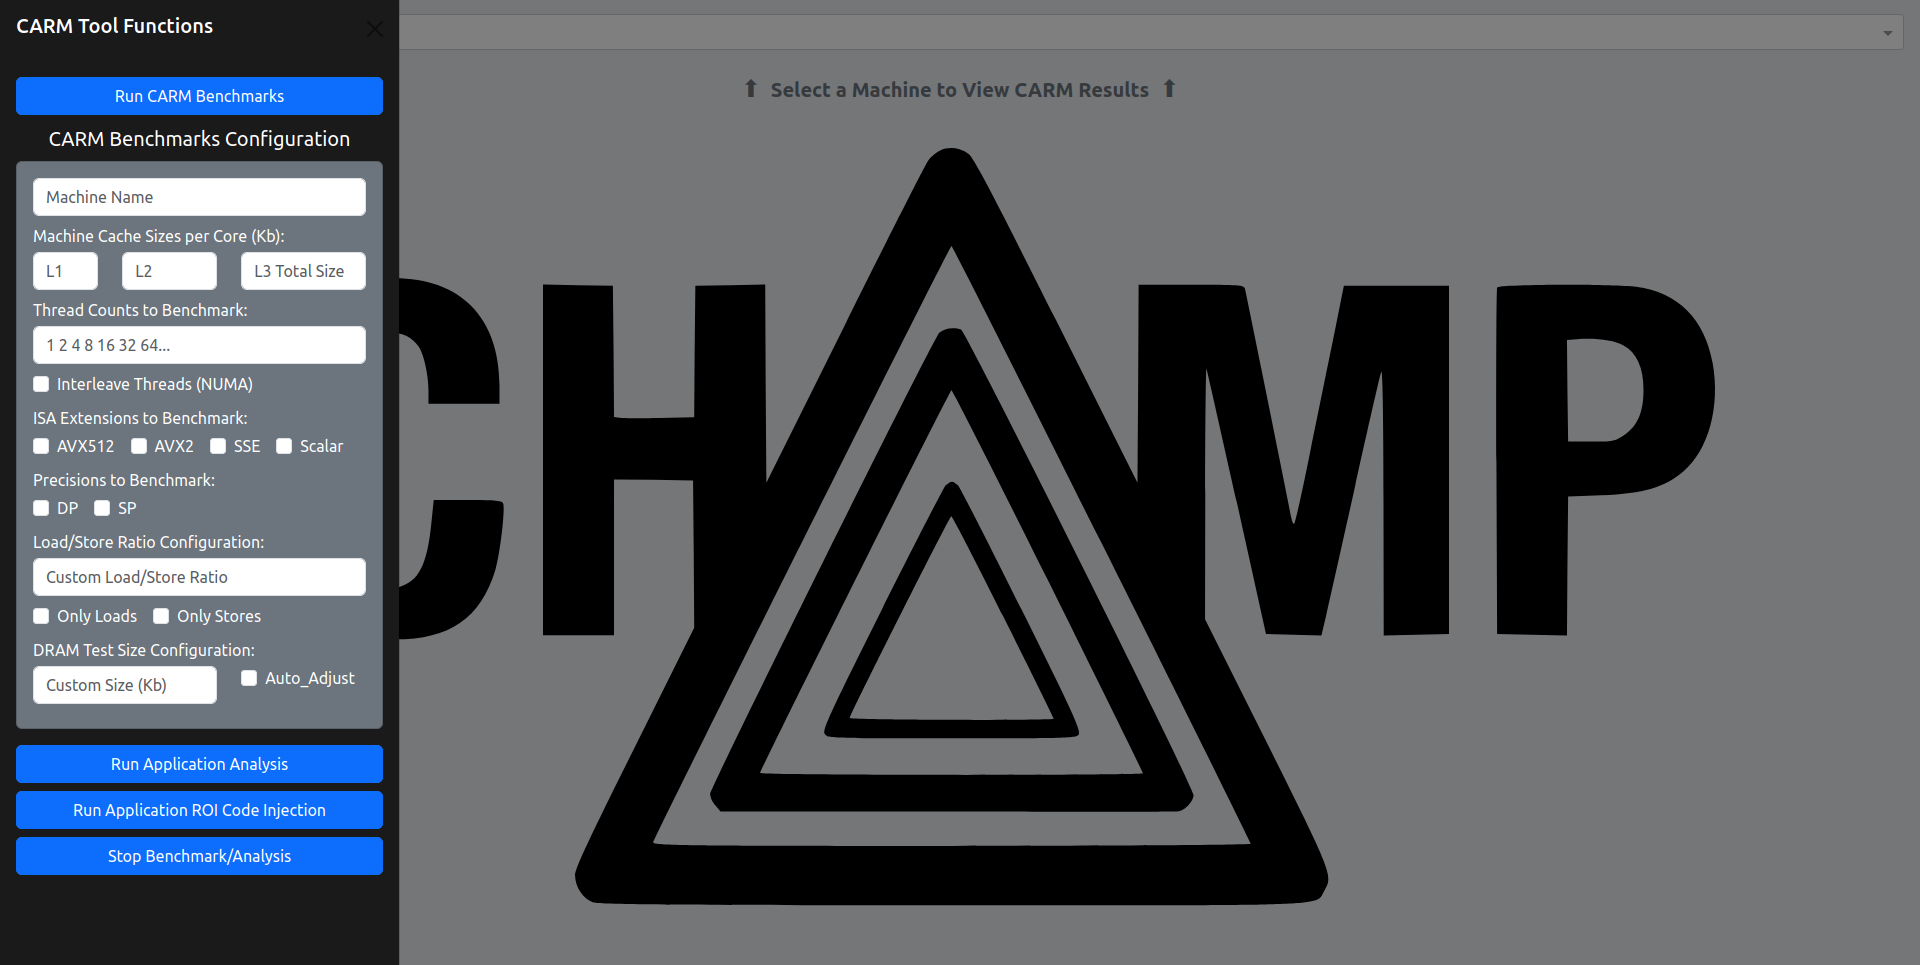
The tool can also be used via the GUI, by running ResultsGui.py, and then opening the provided link in the browser, the CARM benchmarks can be executed by opening the sidebar (shown in image below) and entering your desired configuration values and clicking the “Run CARM Benchmarks” button, the “Stop Benchmark/Analysis” button can be used to stop execution at any time.

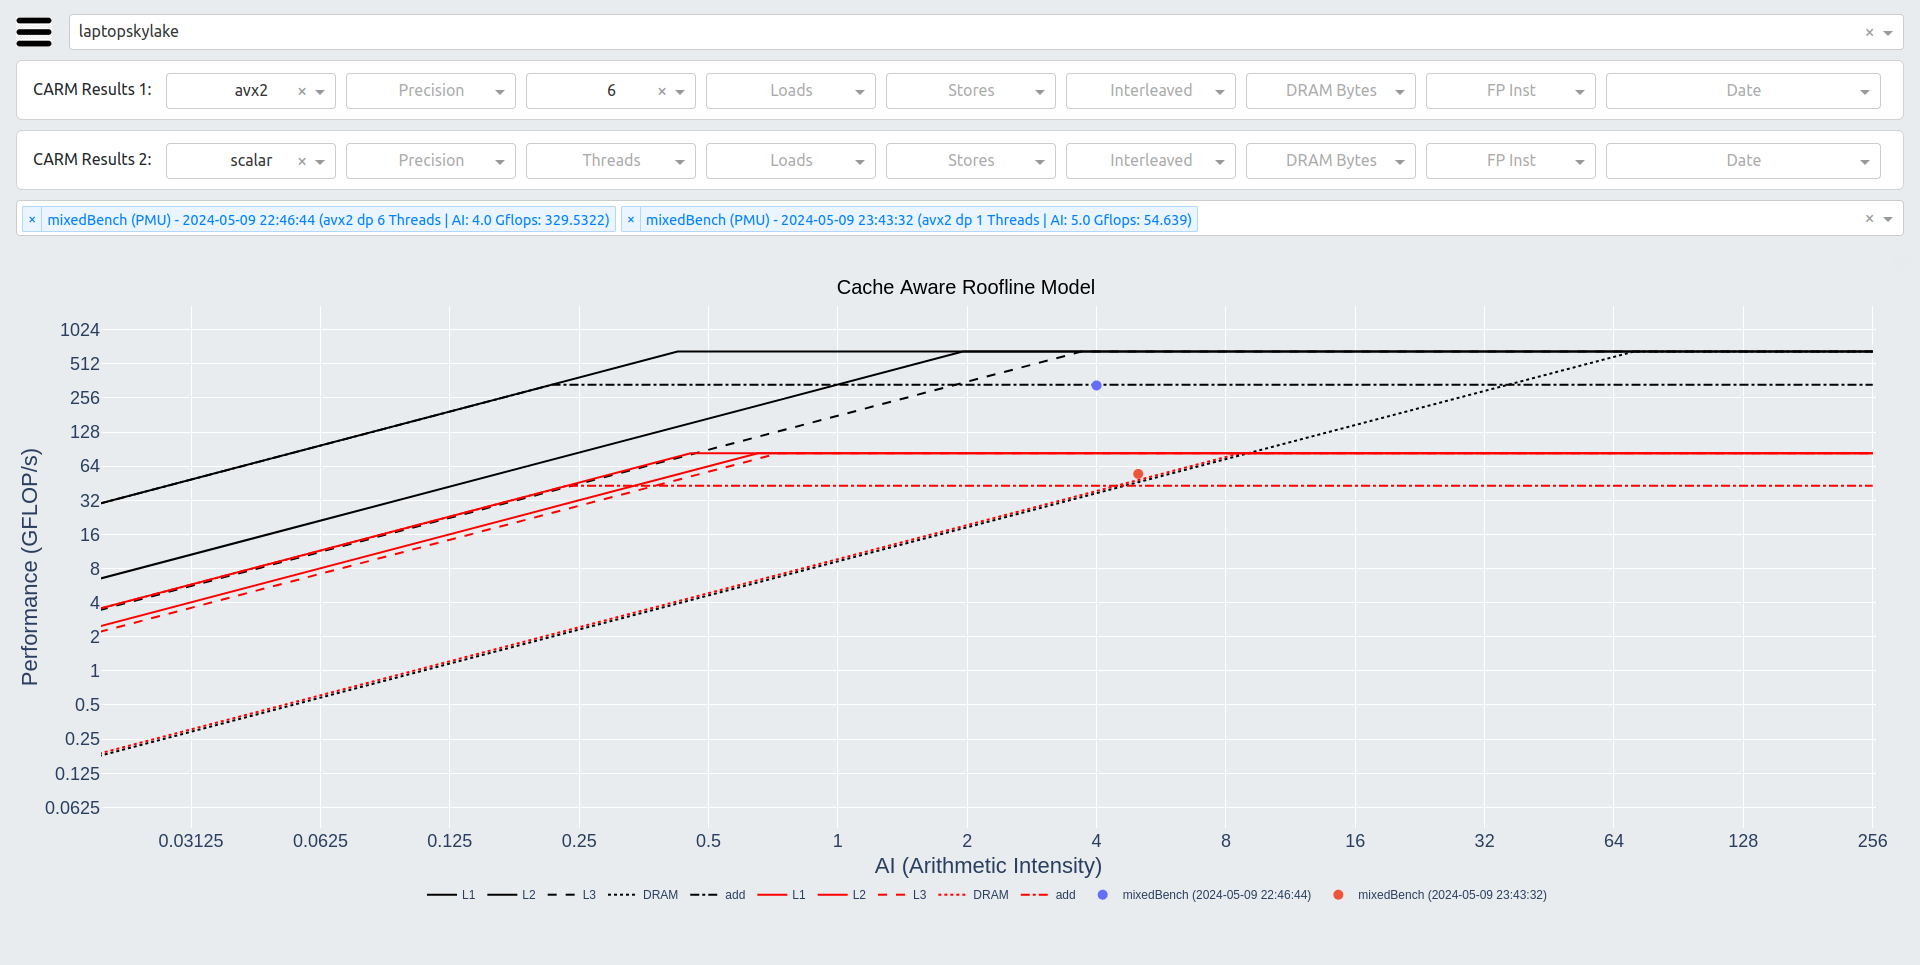
After benchmark execution is finished, refreshing the page should be suficient to view the new results in the GUI as seen in the image below. The tool output during benchmarking will be visible in the terminal where the ResultsGui.py script was launched from. Note that only the roofline test type is available in the GUI.

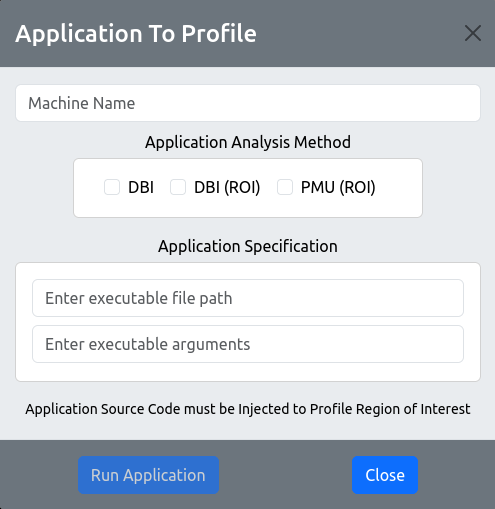
From the GUI you can also execute other functions of the tool, like the application profiling using either DBI or PMUs, this can be done by clicking the “Run Application Analysis” button, then selecting what kind of analysis method is desired (DBI, DBI with ROI, PMU with ROI), and providing the file path to the target application executable along with any arguments that it may take. As can be seen in the following image.

Note that for Region of Interest analysis, the source code must be previously injected with instrumentation code, specific to the DBI method or the PMU method.
In papers and reports, please refer to this tool as follows
J. Morgado, L. Sousa, A. Ilic. “CARM Tool: Cache-Aware Roofline Model Automatic Benchmarking and Application Analysis”, IEEE International Symposium on Workload Characterization (IISWC), Vancouver, British Columbia, Canada, 2024
A. Ilic, F. Pratas and L. Sousa, “Cache-aware Roofline model: Upgrading the loft,” in IEEE Computer Architecture Letters, vol. 13, no. 1, pp. 21-24, 21 Jan.-June 2014, doi: 10.1109/L-CA.2013.6.
Diogo Marques, Aleksandar Ilic, Zakhar A. Matveev, and Leonel Sousa. “Application-driven cache-aware roofline model.” Future Generation Computer Systems 107 (2020): 257-273.

